Homelab
A personal cloud on Proxmox: 10 LXC + 2 VM, ~99% uptime
- Role
- Full cycle: from hardware to alerts
- Period
- 2025 — now
- Stack
- Proxmox VE · LXC · NPMplus · PostgreSQL · Gitea · k3s · Prometheus · Grafana · Technitium DNS

Architecture
Cloudflare DNS
Router · port 443 forward
NPMplus reverse proxy · TLS
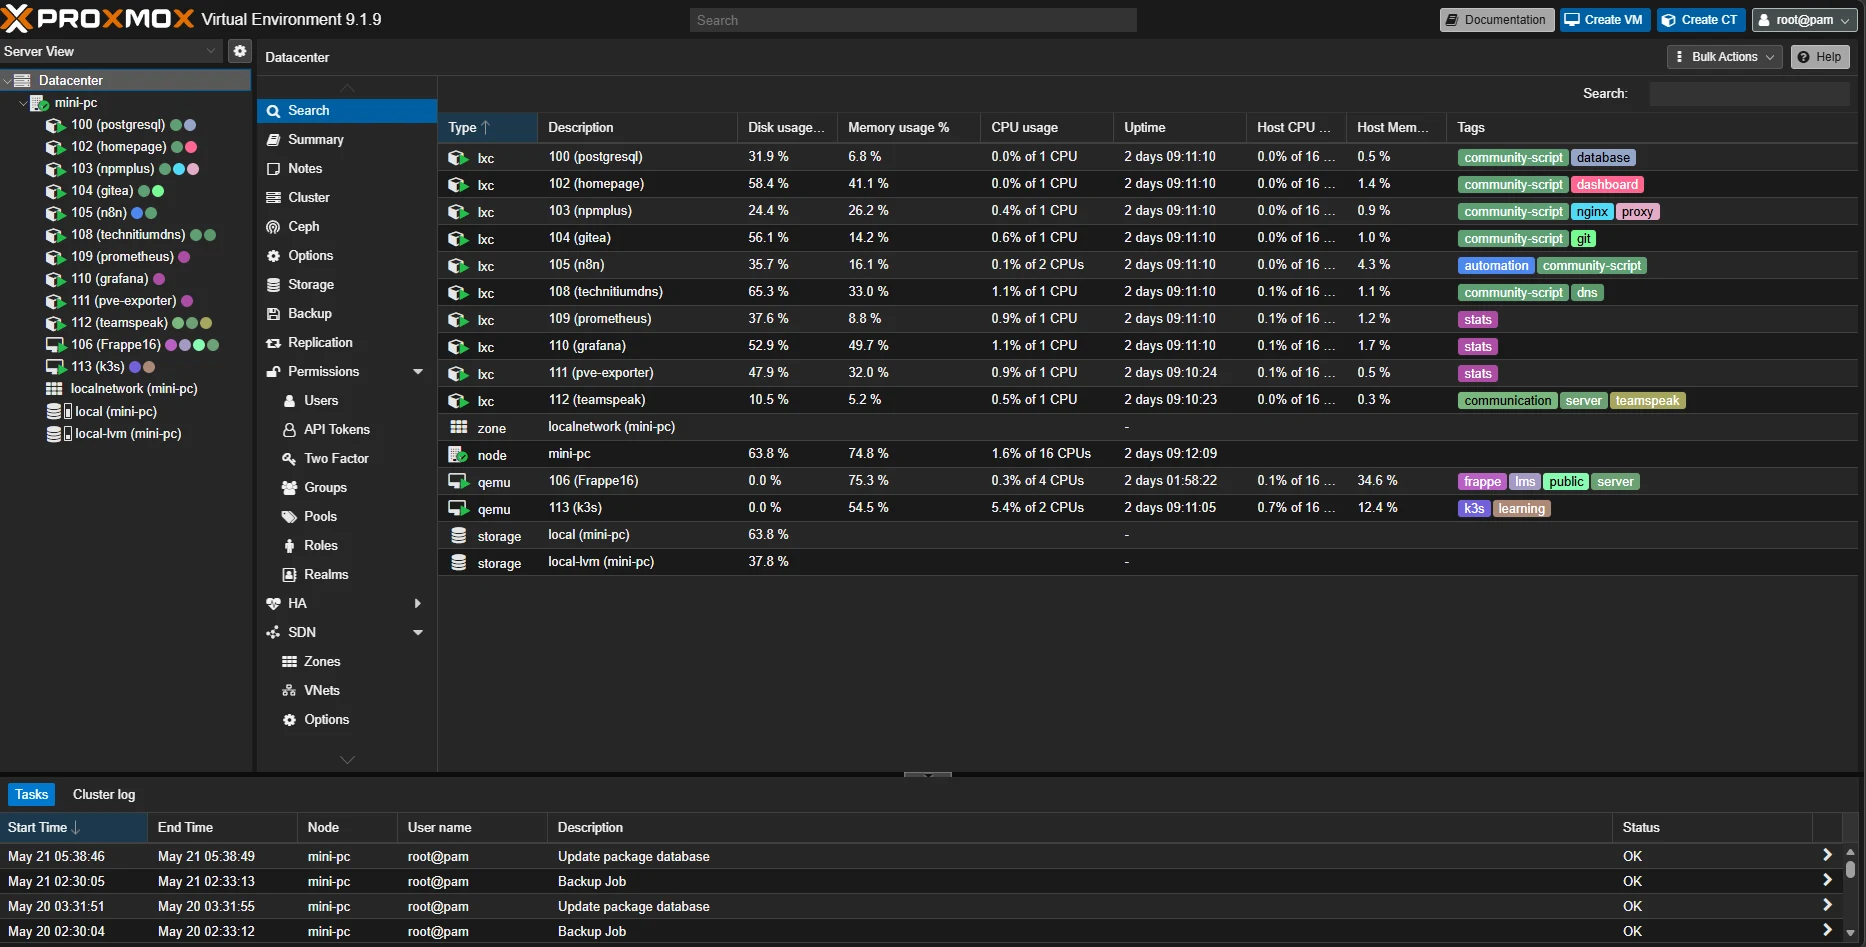
Proxmox VE 9 · mini-PC · 10 LXC + 2 VM
Apps
- Gitea
- n8n
- Homepage
- TeamSpeak
- Frappe LMS · VM
- k3s · VM
Data
- PostgreSQL · shared
Observability
- Prometheus
- pve-exporter
- Grafana
Network
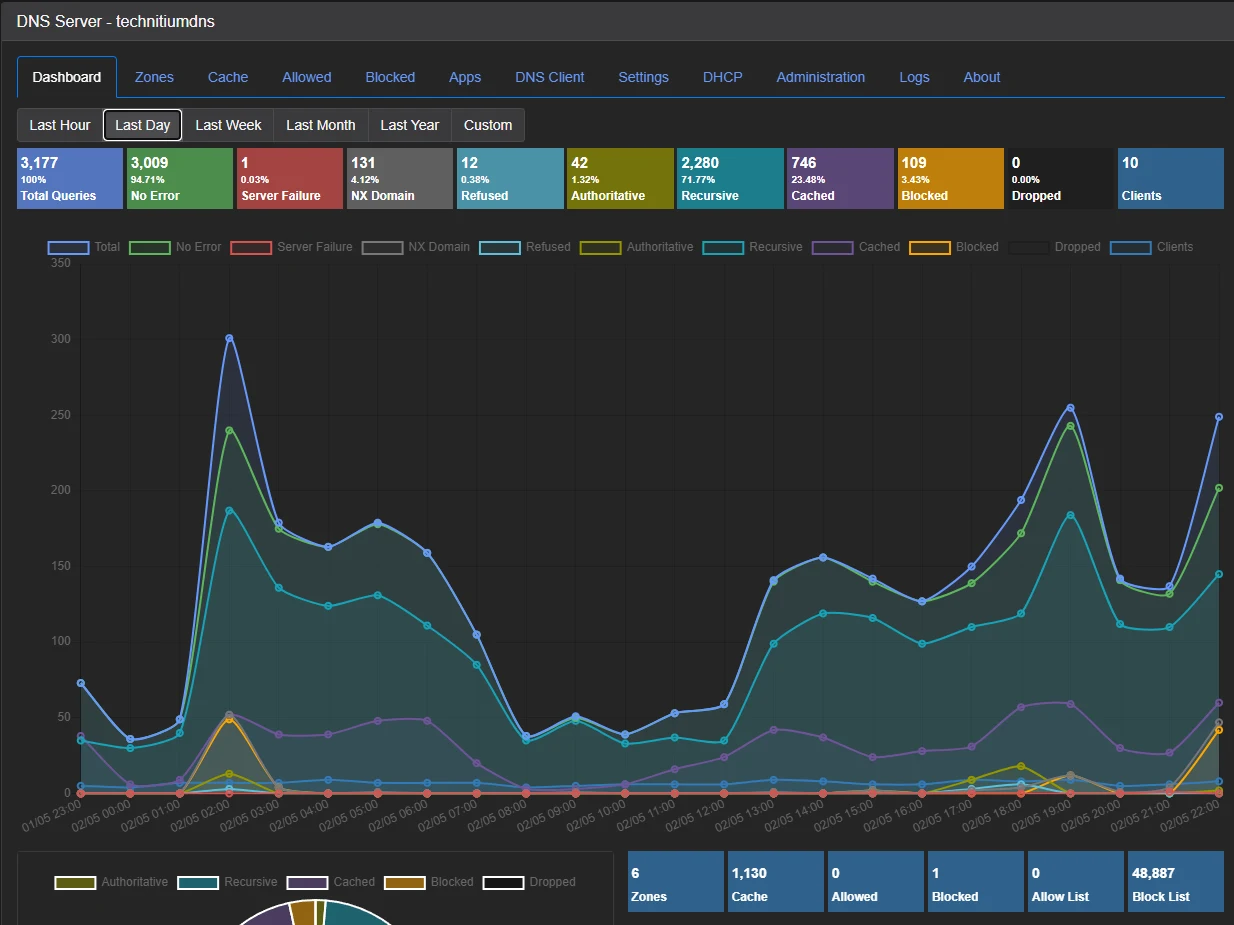
- Technitium DNS
ZFS snapshots & automated backupsTelegram alerts
Outside: DNS on Cloudflare and port 443 forwarded to NPMplus, which terminates TLS and routes traffic to services. Apps live in separate LXC containers, Frappe LMS and a k3s sandbox in QEMU VMs, and a shared PostgreSQL serves four-plus services.
Observability
- Per-container CPU, memory, disk and network metrics, scraped every 15 seconds
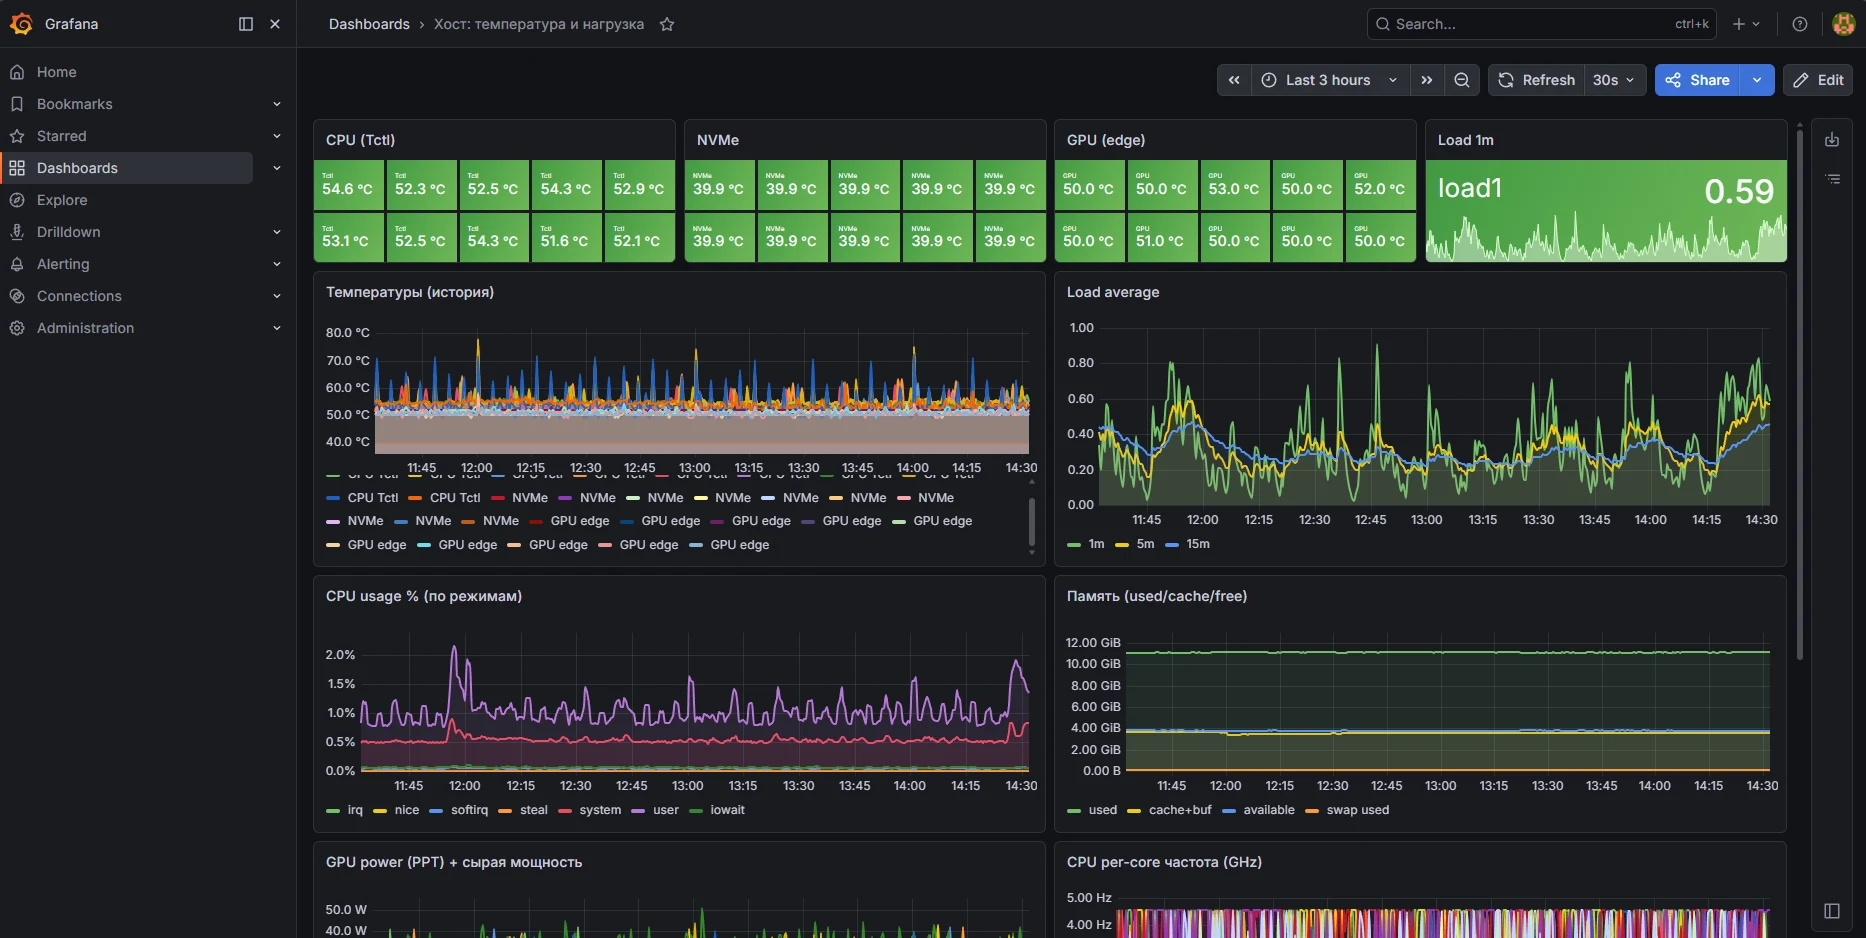
- Grafana host dashboards: temperatures, load, CPU modes, memory
- Telegram alerts on anomalies and failures
Screens
3